How to Debug Node JS Application in VS code
Developers use Node.js, one of the most popular JavaScript runtime environments, just like the V8 engine used by browsers like Google Chrome. This platform allows you to create command-line applications and server-side web applications with bug-free code. Developers should use tools like Visual Studio Code to check the code after it’s written to produce an error-free application for clients.
To know more about debugging, and how to carry out the Node.js application debugging process using VS Code, let’s go through this blog. Before you hire Node js developers in India or across the globe, you should gather basic knowledge about Node js fundamentals like node libraries, Node js streams and node js debugging process.
1. What is Debugging?
Debugging is known as one of the most important concepts of the web app development process. It is an art that enables the developers to fix defects in the software. With this process, developers can easily fix the bugs after finding the cause of the issue in the application and for this, the developers have to spend a lot of time locating it.
And in order to avoid issues, there are some ways that the programmers can follow. Here are some of them –
- To avoid debugging issues the developers need to use a source control system similar to Git as it can help in managing revisions, using a code editor with line numbering or color-coding can also be beneficial, and Node.js developers can also use test-driven development approach to test the operation of the functions before it is written by the experts.
- Developers working on JavaScript code must adopt bug-tracking systems like Bugzilla or Jira as they help in highlighting duplicate codes, reporting bugs, and tracking the bug-fixing process.
1.1 Debugging in Node js
When it comes to debugging the Node.js application, web app developers use Visual Studio Code itself as it makes debugging a straightforward process. This means that with Node.js applications can be easily debugged using the VS Code editor that offers an in-built debugger. This also means that developers can use it for debugging applications created using JavaScript or any other language that gets compiled in the VS code editor.
2. Things to Learn Before Debugging Node js Application
Whenever any software development team starts working on the debugging of a Node.js web application, first of all, the developers need to install both Node.js and VS Code on the local machine. To install the latest version of Node.js and VS Code, the development team needs to visit the official site of both. And then follow the instructions given on the site to set up the VS Code on Windows and create a Node.js application project in it or use the existing project.
2.1 Prerequisites
Before starting the Node.js application debugging process, the developers need to have a proper setup as described below :
- Node.js developers need to have the latest version of Visual Studio in their systems.
- Node.js must be locally installed in the system. For that, the developer can visit its official site where he can also learn how to install Node.js and create a development environment for locally developing an application.
- Besides this, the Node js debugger for the Chrome extension should be installed in the VS Code.
3. Debugging Node.js Applications in Visual Studio Code
When it comes to debugging a Node.js application using Visual Studio Code, the process becomes much easier as this code editor enables the development teams to have any debugging client that can directly connect to the Chrome DevTools Protocol for debugging. While conducting debugging, experts prefer code editors and Node js IDEs like Webstorm and Visual Studio Code as they come with built-in debugging tools.
To see how this is possible with Visual Studio Code and how software development companies can actually debug an application using it, let’s go through this section.
3.1 Launching a Debugging Session
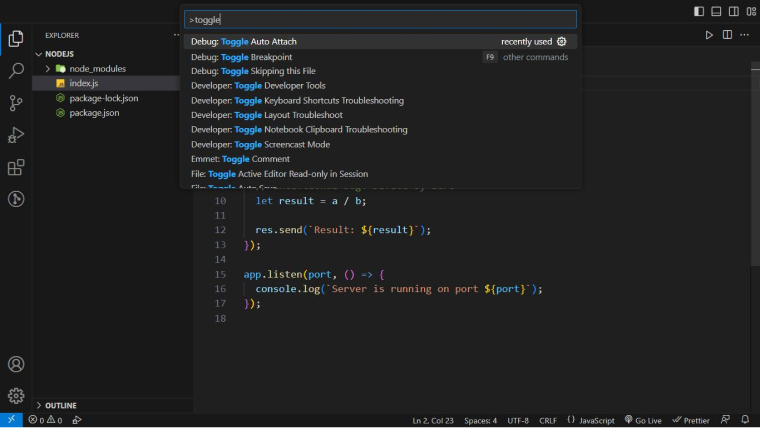
The very first step is to launch the debugging session and for that, there are several ways especially when it comes to VS Code. The first method that we will see here involves toggling the Auto Attach feature that enables the developers to automatically attach the Node.js processes with the editor. But only those processes that are launched from the integrated terminal can be attached here. And in order to do that, the developer just needs to press Ctrl+Shift+P which will open the Command Palette and after searching for Toggle Auto Attach in the palette, the developer can hit enter on the appropriate option as per the requirement to see the result. The below image shows the same process.
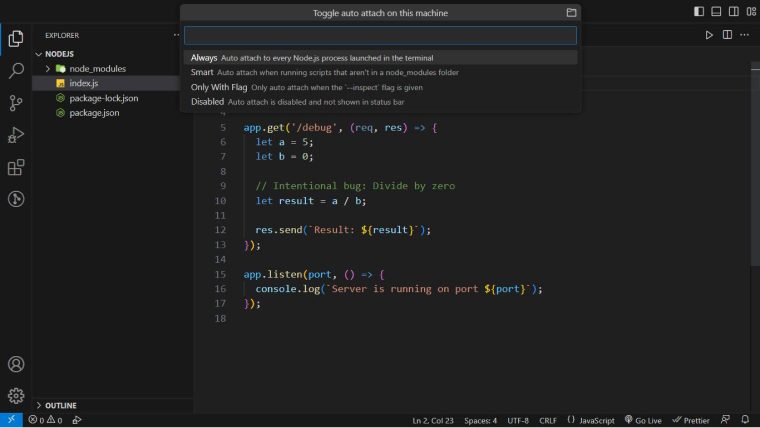
The developer adds a new status bar item on the screen at the bottom to show that auto-attach is enabled after selecting the preferred auto-attach mode. If not required, the developer can also disable or change the mode of the auto-attach status bar, as shown in the below image.
To launch a new integrated terminal instance in Visual Studio Code with the auto attach feature enabled, press Ctrl+Shift+`. Then, type the following command line to start the debugging session:
node --inspect index.js |
The output of the above debugger statement will be as follows :
Node js Debugger listening on ws://127.0.0.1:9229/3f48d9f9-4149-4d69-99bd-ee876ab1960c
For help, see: https://nodejs.org/en/docs/inspector
Debugger attached.
Server is running on port 3000
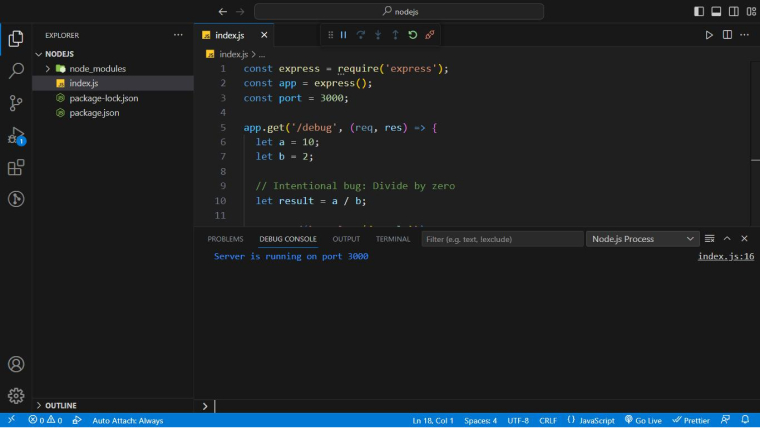
Now, the debugger is attached to Visual Studio Code automatically, and the status bar in VS Code has turned orange to indicate to developers that debugging can begin.
You can also debug a running code by executing a JavaScript Debug Terminal. For this, the developers need to press Ctrl+Shift+. This will open the integrated terminal and from there, the developer can choose the JavaScript Debug Terminal option which is available in the drop-down menu of the Launch Profile, as shown in the below image.
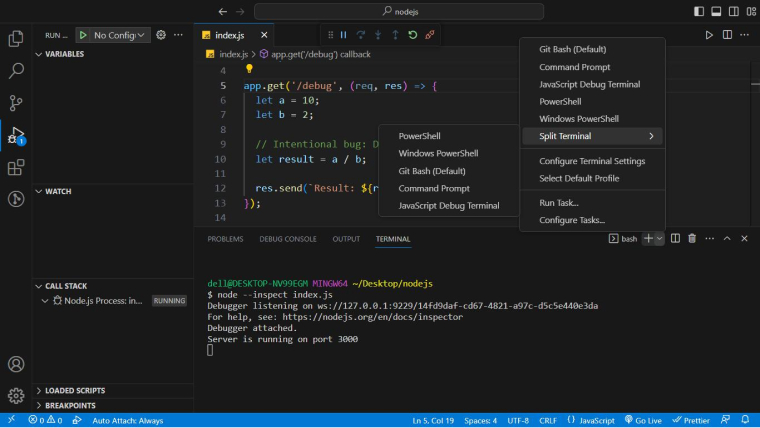
After the programmer follows the above commands and opens the terminal profile in order to navigate the project directory of the application and start the Node.js project, he will be able to see that the Node js debugger is attached automatically.
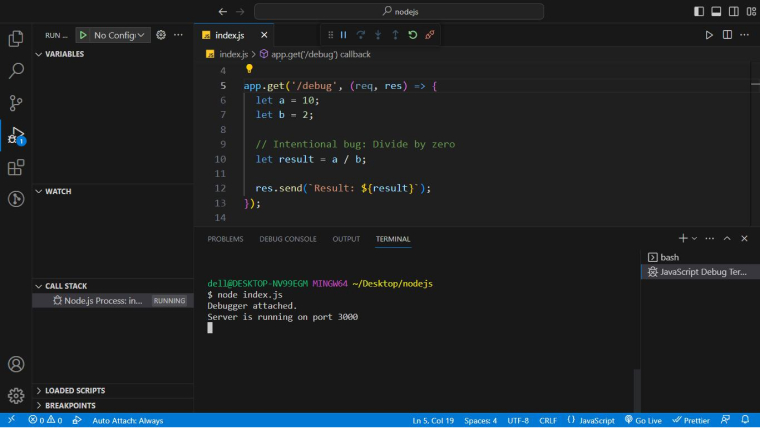
To launch a debugging session, you can also go to the Run menu of the system and choose the Start Debugging entry. These steps will enable a developer to execute the currently active file and also start a debugging session. And if by following these steps the Visual Studio Code fails to detect the debugging environment, the developer can manually choose the right option from the dialog that the Run menu show. Here’s the image that showcases the same case.

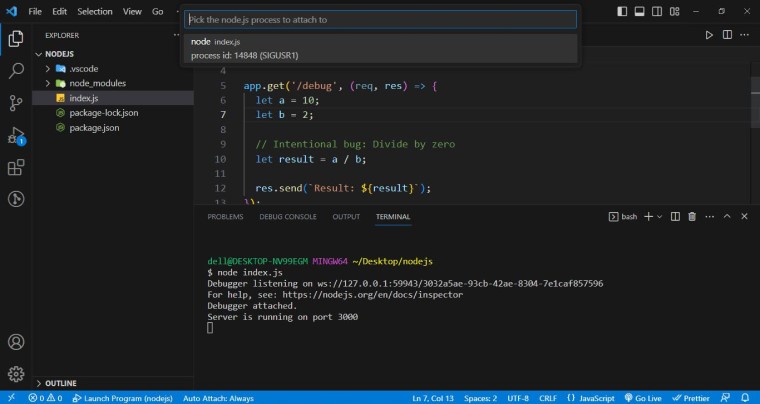
Developers can also debug Node.js applications that weren’t started using Visual Studio Code by enabling the V8 inspector on the application and then selecting “Debug: Attach to Node Process” from the command palette in Visual Studio. This will open a list of all the Node.js processes present in the system, and the developer can choose the project that needs to be debugged.
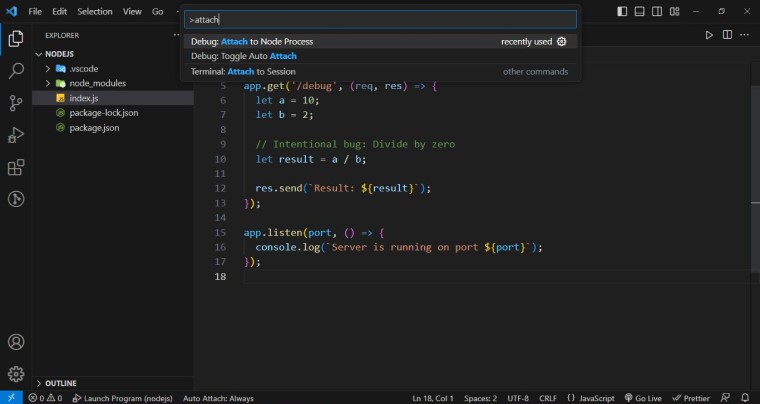
When you find and select the project that needs to be debugged, Visual Studio Code will immediately launch the debugging session, as shown in the image below.
Here, if the development team wants to have a specific setup for configuring the file and having a reusable debugging option, all one needs to have is create a launch.json file inside the .vscode folder in the root of the Node.js project. For instance, if there is a folder of the project that is open in Visual Studio, the developer can create a configuration file for it by just clicking the create a launch.json file link in the panel that says Run and Debug. Developers must select the Node.js environment if prompted, as shown in the image below.
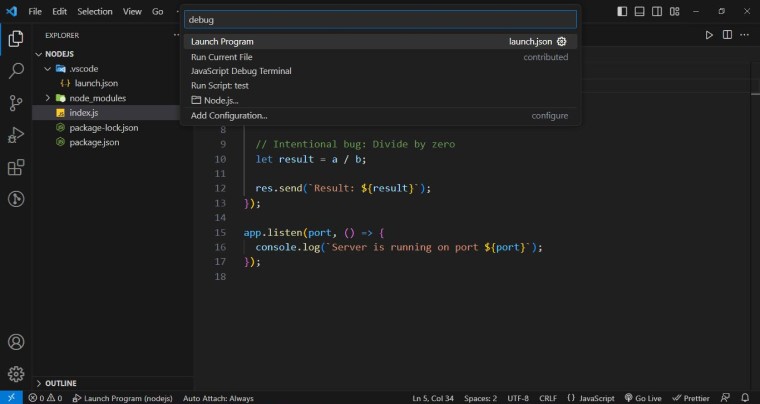
Once you have carried out the above process, the Visual Studio Code editor will create and open the launch.json file, as specified in the below .vscode/launch.json code.
{ // Use IntelliSense to learn about possible attributes. // Hover to view descriptions of existing attributes. // For more information, visit: https://go.microsoft.com/fwlink/?linkid=830387 "version": "0.2.0", "configurations": [ { "type": "node", "request": "launch", "name": "Launch Program", "skipFiles": [ "/**" ], "program": "${workspaceFolder}/index.js" } ] } |
This program sets out which file to execute when the Node.js debugger launches, and the field name specifies a recognizable name for the drop-down menu of the Debug launch configuration, which includes various options and scenarios for debugging. Once you set up the debugging configuration for the project, you can launch it by clicking the green button in the drop-down menu of the Run and Debug configuration option.
3.2 Creating a Breakpoint
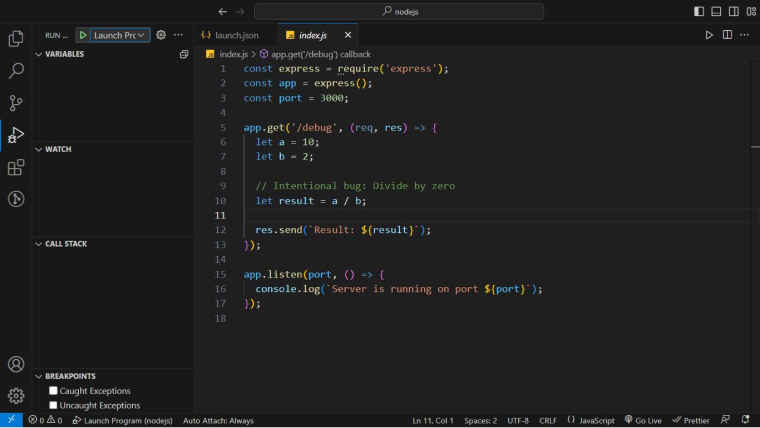
After launching the debugging session, you can create a breakpoint by clicking the line numbers in the project file. Once the developer sets the conditional breakpoint in the file, there will be a bright red indicator on the left side of the code line. Clicking the red indicator removes the breakpoints. To check more options for the breakpoint, the developer needs to right-click the breakpoint indicator. The indicator will look as seen in the below image.
3.3 Using the VS Code Debugging Panel
After setting the breakpoint, it’s time to use the Visual Studio debugging panel, and for that, the developer has to open the debug panel by clicking the bug icon present on the sidebar. Opening the panel will display four different sections: variables, watch, call stack, and breakpoints.
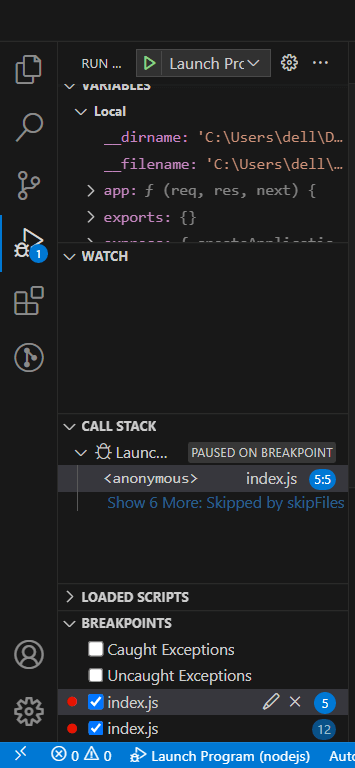
In the Visual Studio Code debugging panel, the developer will be able to see a green play button and a dropdown menu at the top that says No Configurations if the developer hasn’t created a debug configuration, and if he has, he will be able to see the configuration file listed here. Visual Studio Code stores all debug configurations in a file named launch.json in the .vscode folder to help developers create folders or files and generate predefined configurations.
In order to create the very first launch.json file, the developer needs to click the No Configurations dropdown and then select the Add Configuration option, this will help you create the first configuration.
3.4 Creating Logpoints
The next step is to create a logpoint. This is a process that helps in logging in the messages or values to the Node js debugger console without actually using console.log(). For this, the developer needs to add messages one by one by right-clicking the gutter option available beside the line number and then choosing the Add Logpoint option.
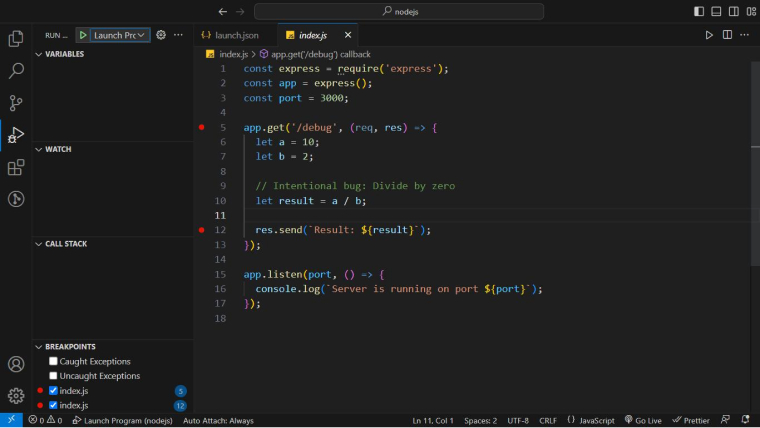
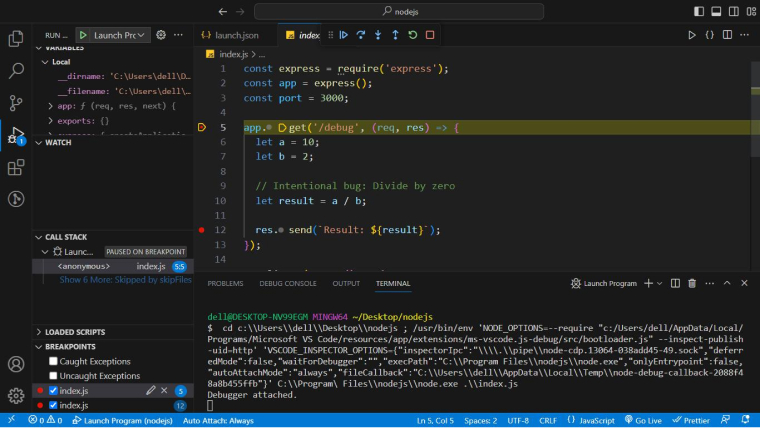
After you add the message, you will see an input field where you can add a new message to log into the Debug Console. To log the variable value for code execution, you must place it in the Log Message field with curly braces.
3.5 Debugging TypeScript With Source Maps
The last step in debugging the Node.js application in VS Code editor is trying to debug it using Typescript with source maps. With time, TypeScript continues to grow more popular and it makes developers use this language while working with Node.js projects more than ever. And Visual Studio Code makes it possible for developers to debug TypeScript-based projects. And for this, the very first thing a developer can do is create a tsconfig.json file in the root directory of the Node.js project and then enable the source maps using the following command line.
{ "compilerOptions": { "sourceMaps": true }} |
The next thing to do is attach the processes that are currently running and set the breakpoints in the TypeScript file. By doing so, the developer can direct the VS Code to find the source maps and use them. In order to do so, the developers need to add an attribute called outFiles in the launch configuration file and make it point to the exact location, as shown in the below code.
{ "version": "0.2.0", "configurations": [ { "type": "node", "request": "launch", "name": "Launch Program", "skipFiles": [ "/**" ], "program": "${workspaceFolder}\\index.js", "outFiles": "${workspaceFolder}\\index.js", } ] } |
To run the project without a build step using ts-node, use the following code:
{ "version": "0.2.0", "configurations": [ { "type": "pwa-node", "request": "launch", "name": "Launch Program", "skipFiles": [ "/**" ], "runtimeArgs": [ "-r", "ts-node/register" ], "args": [ "${workspaceFolder}/src/index.ts" ] }] } |
In the above code debugger, there is no program attribute, which means that during the runtime args registers ts-node and takes it as the handler for TypeScript files.
4. VS Code Advanced Debugging Configuration
Next, we will learn about the advanced debugging configurations in Visual Studio Code for debugging Node.js projects on virtual machines, other devices, or with launch options like nodemon.
Visual Studio Code generally stores launch configurations in a hidden launch.json file in the .vscode folder in your project. And in order to access that file, the developer will have to click on the link that says create a launch.json file which is at the top of the Run and Debug panel and then select the Node.js environment as the project is based on Node.js.

While the developer is configuring the Node.js project, he can get access to many different setting objects to the “configurations”: [] array with the use of the button named Add Configuration. Visual Studio Code can help you launch Node.js processes or debug Web Socket servers. The above image shows the launch of the configuration using a nodemon.
You can carry this out by just clicking the node option in the Add Configuration, which also helps you edit the “program” property of the file so that it can directly point towards the entry script. And then the developer needs to save the launch.json file and choose node from the Run and Debug panel’s drop-down list and click the green run icon which will help in starting the application.
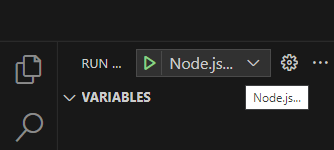
After the application starts, the developers can easily set a breakpoint or a logpoint as seen in this blog.
5. Conclusion
To debug applications created using Node.js, you need to use the right tool, such as Visual Studio Code. Though there is nothing wrong in doing that using console.log(), VS Code can be preferable as it helps in finding and fixing complex issues in the Node.js projects.
6. FAQs about Node js Debugger
6.1 What is node js debugging?
Node.js Debugging refers to the process of finding and fixing bugs in computer programs.
6.2 How do I remotely debug node JS?
With Chrome DevTools, users will be able to locate and click on the vertical ellipsis menu located in the upper right corner.
For next, please navigate to the following path:
- More Tools > Remote Devices.
- Once there, locate “Network targets” and under which click “Add address.”
- Provide the value, e.g. “9229”
- When the address is entered and the remote target has been established, the Node.JS icon will appear in the upper left corner of the DevTools window.
- To initiate the DevTools Node js Debugger, please click on the NodeJS Logo.
6.3 What are the 3 debugging tools in an embedded systems?
- PC-Lint: Developers extensively employ a tool for the analysis of code written in the C and C++ programming languages.
- Valgrind: A widely-used open-source tool detects memory leaks.
- LabVIEW: It is a graphical programming environment that incorporates simulation functionalities for a range of embedded devices.
6.4 How to debug a js function?
Place breakpoints in the JavaScript code within the Node.js debugger window. At each breakpoint, the debugger will pause the execution of JavaScript code so you can examine JavaScript values. Upon careful analysis of the values, it is possible to proceed with the execution of the code, usually by utilizing a play button.
6.5 What are the 5 different methods for debugging?
Ans: You commonly employ various methodologies and strategies in the process of debugging, including code examination, debugging tools, unit testing, integration testing, system testing, monitoring, and logging.The identification and resolution of problems in a software system is a continuous procedure that often requires numerous efforts.

Hardik Dhanani has a strong technical proficiency and domain expertise which comes by managing multiple development projects of clients from different demographics. Hardik helps clients gain added-advantage over compliance and technological trends. He is one of the core members of the technical analysis team.
Laravel is developed by Taylor Otwell and is a framework used for effective web development. It was developed using the PHP programming language....
 Oct 31, 2023


Comments
Leave a message...